Last year was the year of PHP profiling tools. Companies like Qafoo, Zend and SensioLabs have released its own profiling tools. Bottlenecks or inefficient code is a thing of the past. All PHP profiling tools are awesome and have its own advantages. This is a quick overview, so you have a good starting point to choose your PHP profiling tool which fits your needs. At the end of this blog post you find a comparison matrix.
An extended german version is available on entwickler.de
Profiler measures the relative performance of the application while benchmarks analysis the actual performance (end user experience). Many of us know the Xdebug Profiler or XHProf, but alongside of these veterans there are more Profiler like Z-Ray, Blackfire and Tideways.
Zend Server Z-Ray
Z-Ray works also without Zend Server. See Z-Ray Technology Preview.
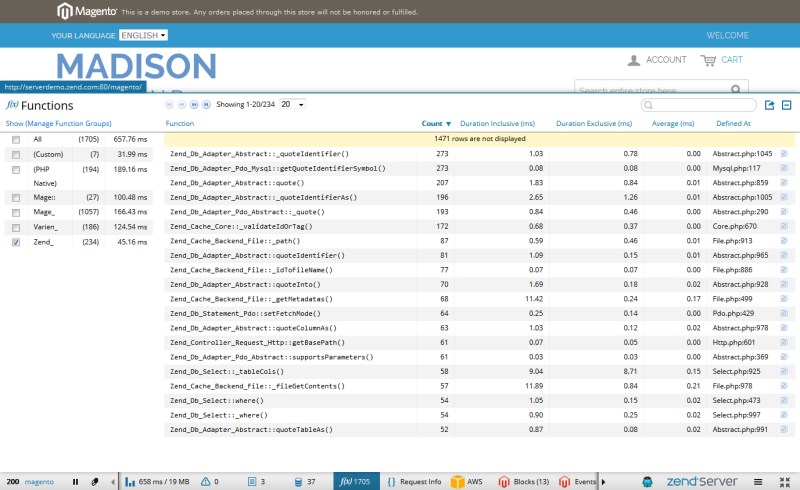
Zend Server Z-Ray is really awesome. You get so much information in the toolbar about the request, your used frameworks, MySQL queries, Amazon AWS and much more. See the demo page for some impressions. You can also write your own extensions in plain PHP. If you are a Zend Certified PHP Engineer you can use it for free in development. The profiling data is stored locally and are not send to an external server. You can use it also in production. Unfortunately, there is currently no comparison of two requests and no call graph available. Also Callers (Parent Calls) and Callees (Child Calls) are not available.
Blackfire Profiler
The Blackfire Profiler is another great PHP profiling tool and is not based on XHProf anymore. The code was completly rewritten. An interesting feature is that Blackfire achieves a new level of accuracy by aggregating several profile samples and getting rid of non relevant data. Meanwhile, there are also enterprise features like database query analysis or private sharing of profiles. See blog for new features. You can use it in production. Note that all data is securely sent to the Blackfire server.
Tideways aka Qafoo Profiler
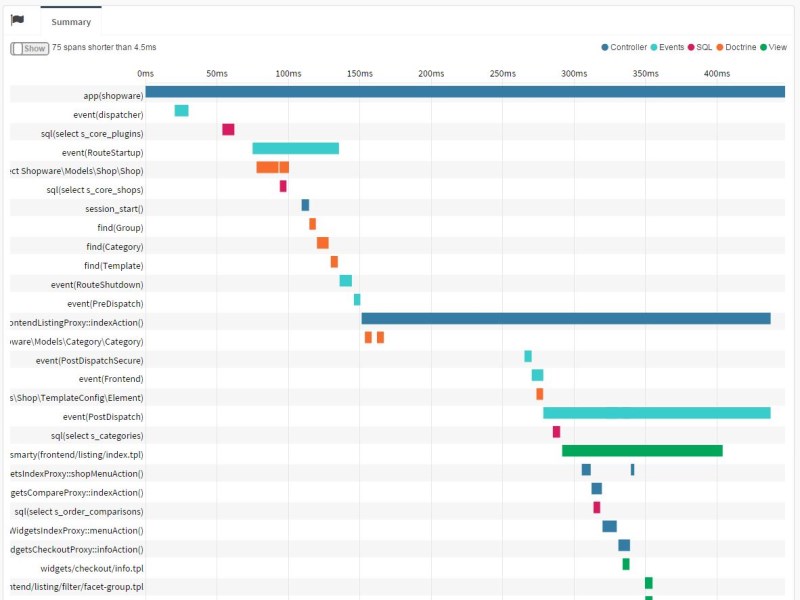
Tideways runs with very low overhead and can be used in production. There is no free version available, but there are several pricing plans. The profiling data can be grouped in transcations and there is a bootleneck and slow external calls detection. I really like the new Timeline feature, which collects time spans of interesting events that happened during a request. You can find more about the Profiler features in the Tideways blog and it's possible to write own extensions. All data is securely sent to the Tideways server.
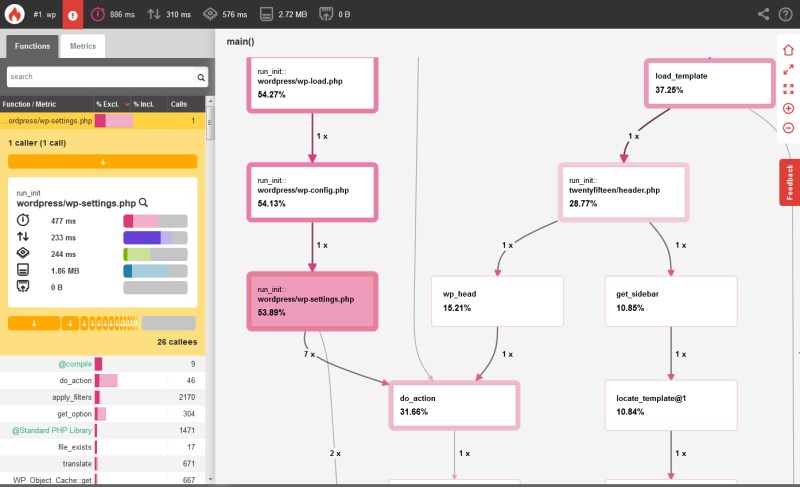
XHProf & XHGui
I've worked some years with XHProf and XHGui. This is really useful and can also be used in production. There is a great dashboard with all information you need and you can compare different requests with each other. A call graph is also available. The installation is easy and there are some good posts on techPortal and Engine Yard.
Xdebug Profiler
Xdebug profiling is the easiest way to start profiling if you have already configured Xdebug but it's not so easy to analyse the problems. PHPStorm has a good documentation about profiling PHP applications with Xdebug or you can use other tools like KCacheGrind or xdebugtoolkit. You should not use Xdebug in production.
Comparison matrix
This comparison covers not all features of every single Profiler , but I think it's a good overview. Please have a look at the specific product page to make your final decision. Most of the Profiler have additional features.
| Profiler / Feature | Free | Ext | DL | CR | CG | PC | CC |
|---|---|---|---|---|---|---|---|
| Z-Ray | +/- | + | + | - | - | - | - |
| Blackfire | +/- | - | - | + | + | + | + |
| Tideways | - | + | - | + | + | + | + |
| XHProf/XHGui | + | - | + | + | + | + | + |
| Xdebug | + | - | + | - | + | + | + |
| Mem | DQ | EW | FF | NB | ET | ME | |
| Z-Ray | + | + | + | + | + | + | + |
| Blackfire | + | +/- | - | + | + | + | - |
| Tideways | + | +/- | +/- | + | + | + | + |
| XHProf/XHGui | + | - | - | + | + | + | - |
| Xdebug | - | - | - | +/- | + | - | - |
| Legend | |||||||
| + = Supported - = Not Supported +/- = It depends Free = For Free Ext = Extension Interface Available DL = Data Stored Locally CR = Comparison Of Requests CG = Call graph PC = Callers (Parent Calls) CC = Callees (Child Calls) Mem = Memory Info DQ = Displays Database Queries EW = Displays PHP Errors & Warnings FF = Function Filter NB = Non Browser Request Support ET = Several Execution Times ME = Monitor Events | |||||||
Conclusion
After years of little progress in terms Profiler was observed, is now for every application a suitable Profiler available. Every Profiler has individual features and analysis options. Due the complexity of this area, there is no winner. Everyone has to decide for yourself which Profiler fits your needs. SensioLabs, Qafoo and Zend will definitely further develop the Profiler. I'm very excited, which features the companies introduce in the next months. If you are a Docker PHP Developer you should checkout these Docker PHP Profiler images.
Do you know other PHP profiling tools or do you have some additional suggestions? Please leave a comment. If you are looking how to improve PHP code, check out the article 15 hints for high quality PHP projects.